Venn Diagram Math Lesson Plan to Teach the Concept of Sets
A Venn diagram is a century old technique but still very useful for graphically representing sets (or groups) of data. Using a Venn diagram may help students grasp math concepts. Go through this example with your students to help them grasp math concepts.
What is a Venn Diagram
A Venn diagram is the graphical representation of different sets of data by means of a closed curve (normally circles). Individual closed curves (circles) of Venn diagrams represent the individual sets of data. The Intersection and union of the circles represent interrelations between the different sets of data.
Using a Venn Diagram to Teach Sets
We will discuss the procedure of constructing Venn diagrams with an example. Let’s say we have to construct a Venn diagram for “animals”. The steps for constructing this Venn diagram will be:
-
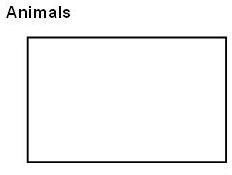
You have to draw a rectangle called “universe”.The universe consists of “everything we are interested right now”. Let’s name our universe as “Animals” like below:
-
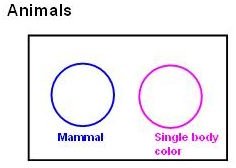
Let’s say we have to deal with the following lists of data: tiger, monkey, elephant, crocodile and peacock. And all the data needs to be classified in two categories (or two sets) as: mammal animal and single body colored animal.
-
For representing the two sets we have to draw two circles as below:
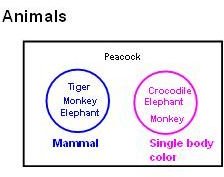
- Now we will put all the data to the suitable area of the diagram as below:
- Please observe that “Elephant” and “monkey” fall in both the category and hence are placed in both circles. Hence the modified Venn diagram will be:
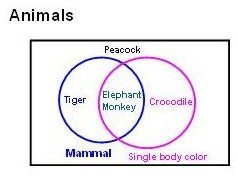
The combined area of the sets (the area, where elephant & monkey are placed) is called the intersection of the sets and the total area of both the sets (the area, where tiger, elephant, monkey and crocodile are placed) is called the union of the sets.
How to Teach With Venn Diagrams
- Explain the concept of Venn diagrams.
- Create a Venn diagram of ten students classified in two sets as: “students wearing black shoes” and “students having black pens”.
- Give them similar problems for solving.
Parabola or any other closed curves could also be used for Venn diagrams. Theoretically there are no restrictions on the maximum number curves.
References
- Author experience teaching math.