It is very important to study precalculus functions and graphs, as this is vital for understanding algebra and calculus. What is a function, how can it be represented in a graph, how we analyze the graph – all those are important questions a mid-school student should be able to answer.
Introduction
Before we are going to study precalculus functions and graphs, we should have a basic understanding of the subject. So, what is a mathematical function? The definition says: “Mathematical function is a relation in which each element of a certain set is linked to one or more elements of another set”. To simplify that, we can say that function is an “entity” whose value is determined by the value of some other element or elements.
Basic Examples
Here is a very basic example of a function:
f(x) = x – 3
In this example, for each value of the variable, “x”, we will have different value of f(x): when x is 3, f(x) is 3-3 = 0; for x=10, f(x) = 7 etc.
Of course, the relation between x and f(x) can be more complicated, such as
f(x) = 2x + 5, f(x) = 10-0.5x, or f(x) = -5x + 2.5.
Note that in all the above examples there is only one variable, x, and it always has the exponent of one. Those are linear functions of one variable, which has a general form of f(x) = ax+b; when “a” and “b” are constants which determine the shape of the graph. Wait, what graph? We have not mentioned graphs yet, haven’t we?
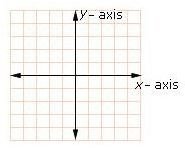
The Axes Graph
When dealing with precalculus functions and graphs and to actually draw a graph of a one-variable function, we will need two axes. The
first (horizontal, or the x-axis) will represent the value of the variable and the second (vertical, or the y- axis) will represent the resultant value of the function (that’s why many times instead of writing “f(x)”, we use “y” as the function representation) The axes, of course, intersect at 0 which is called point of origin, and has the coordinates of x=0, y=0; or (0,0).
Graphical Representation of a Function
Let’s get back to our example function, f(x) = x-3. As we have already said, f(x=3) = 0; f(10) = 7. Since the function is linear, we only need
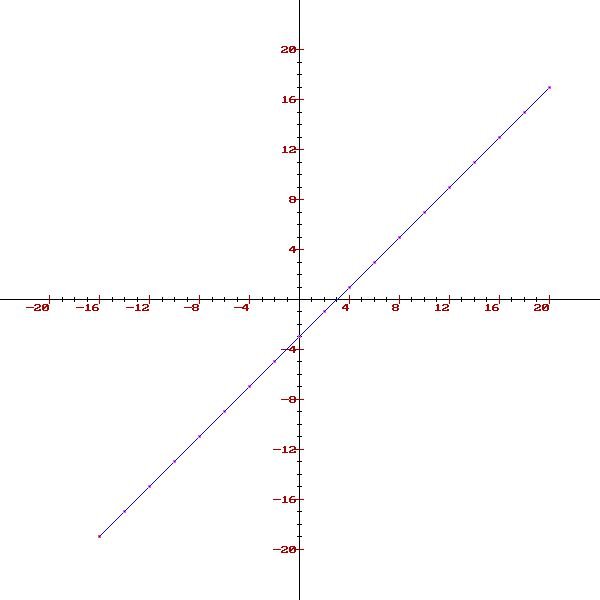
two points on the graph. Let’s take three steps form the point of origin along the x-axis and put a point there. It has a coordinates of (3,0) – and since 0 is the value of our f(x) it is a point on our line. Then let’s go to the x=10, and put a point 7 steps above the x-axis. The coordinates are (10,7) – and this is another point on our line. Connecting two points will produce the line that represents our function. Now, by simply looking at the graph, we can see that for x=0, f(x) = -3 and observe some other values: f(5) = 2, f(-3) = -6…
Generalization
As we said, all linear functions have a general from of f(x) = ax+b. In graphical form, “a” determines the slope of the line (bigger values produce “stiffer incline”, negative values will result in a line “descending” with the increase of the value of x) and “b” is the point of intersection with the y-axis (x=0). In our example, b = -3, and f(0) was, of course, -3.
As an exercise, try to draw graphs of other functions:
- f(x) = 2x + 4
- f(x) = 0.5x-0.25
- f(x) = 8-4x
What Is It Good For?
Precalculus functions and graphs have many uses in later algebra and calculus. A simple example is solving a set of equations .
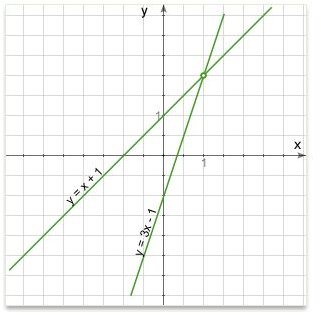
Suppose, you have to solve the set of:
y = x + 1; y = 3x - 1
Instead of doing algebraic calculations, you can simply draw the two lines (functions) on a graph . The intersection point (x=1,y=2) is the solution! Don’t believe me? Check for yourselves – and don’t’ forget to try some other functions as well!
References and Image Credits
https://www.audioenglish.net/dictionary/mathematical _function.htm
https://www.icoachmath.com/SiteMap/x-axis.html
https://www.webmath.com/gline.html
https://gmatclub.com/forum/math-coordinate-geometry-87652.html